Mind Diagnostics (MD) is a mental health startup that allows users to take mental health tests online. It’s free to use, no sign-up is required, and the confidential results are delivered immediately.
MD have a large amount of anonymized meta-data on their users and were looking to understand what factors, if any, increase (or decrease) the chances that a given user will sign up for their tele-therapy offering.
The original project scope consisted of an Exploratory Data Analysis (EDA). Specifically, identifying relationships between User Signups and Visitor Browser, Visitor Operating System, and Visitor State. Extract, Load, Transform (ELT) and Data Cleansing processes were essential steps towards EDA.
The project scope was subsequently expanded to quantify relationships via Multivariate Logistic Regression, as well as Dashboard Creation.
Analysis results were incorporated into a GoogleAds campaign prioritizing spend in select States. The GoogleAds test campaign is currently running and an evaluation will be conducted pending sufficient sample size.
Step 1: Extract Data
- Extract client data from PostgreSQL database
- log_visitor.csv
- log_tests.csv
- goals.csv

Step 2: Load Data

Step 3: Transform Data
- Load into BigQuery tables from GCS
- Build SQL queries in support of downstream analysis

Step 4: Build Data Models
- Connect dbt Cloud to BigQuery
- Refactor Step 3 queries following dbt best practices

Step 5: Analyze Data
- BigQuery + Colaboratory setup
- Exploratory Data Analysis (EDA)
- Multivariate Analysis
- Logistic Regression

Exploratory Data Analysis (EDA):
Browser
Browser Contingency Table
Operating System
Operating System Contingency Table
State
Is there a significant relationship between User Signups and Independent Variables?
Which levels (categories) of the variables are responsible for the relationship?
Browser
Operating System
State
Multivariate Analysis:
The following visuals present logistic regression results of User Signups on Visitor Browser, Visitor Operating System, and Visitor State.
Note: logistic regression coefficients converted to odds ratios
An odds ratio is a measure of the relative risk of an outcome (User Signups in this case) in one population compared with a different population, where odds ratios greater than one indicate the outcome is more likely while less than one is less likely.
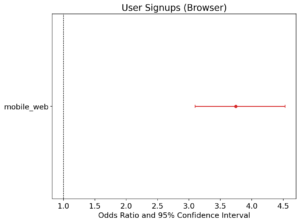
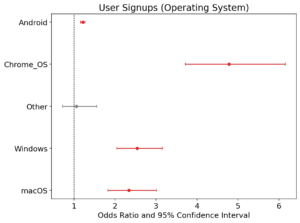
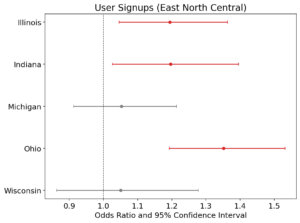
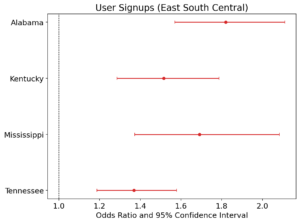
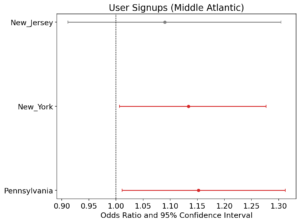
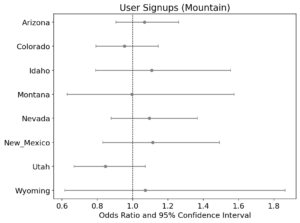
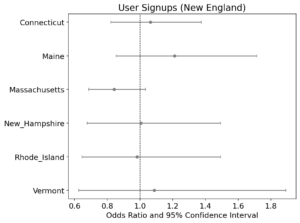
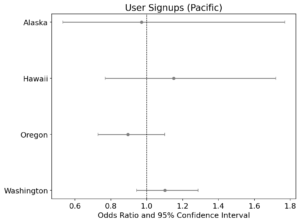
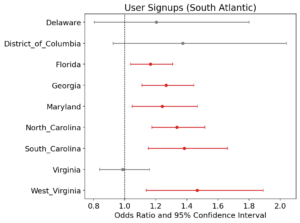
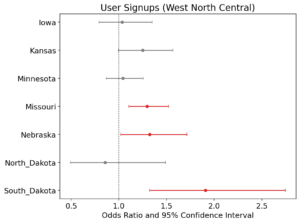
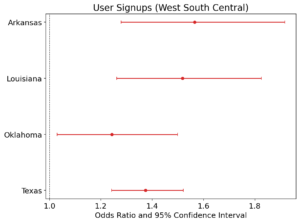
How to Read:
- Dots represent odds ratios
- Odds ratio refers to a comparison group, which is represented by the vertical dashed line. Comparison groups are as follows:
- mobile_web for Browser
- iOS for Operating System
- California for State
- Lines sticking out of the dots are 95% confidence intervals
- Red – Statistically significant relationship exists between User Signups and the group of interest (Does NOT overlap comparison group)
- Gray – Statistically significant relationship does NOT exist between User Signups and the group of interest (Does overlap comparison group)
Step 6: Create Dashboard
Click ‘Looker Studio’ in bottom-right corner for full view